Calculating the Harmonic Ensemble Similarity between ensembles
Here we compare the conformational ensembles of proteins in four trajectories, using the harmonic ensemble similarity method.
Last executed: May 18, 2021 with MDAnalysis 1.1.1
Last updated: September 2020
Minimum version of MDAnalysis: 1.0.0
Packages required:
Optional packages for visualisation:
Note
The metrics and methods in the encore module are from ([TPB+15]). Please cite them when using the MDAnalysis.analysis.encore module in published work.
[1]:
import MDAnalysis as mda
from MDAnalysis.tests.datafiles import (PSF, DCD, DCD2, GRO, XTC,
                                        PSF_NAMD_GBIS, DCD_NAMD_GBIS,
                                        PDB_small, CRD)
from MDAnalysis.analysis import encore

import numpy as np
import matplotlib.pyplot as plt
%matplotlib inline
Loading files
The test files we will be working with here feature adenylate kinase (AdK), a phosophotransferase enzyme. ([BDPW09])
[2]:
u1 = mda.Universe(PSF, DCD)
u2 = mda.Universe(PSF, DCD2)
u3 = mda.Universe(GRO, XTC)
u4 = mda.Universe(PSF_NAMD_GBIS, DCD_NAMD_GBIS)

labels = ['DCD', 'DCD2', 'XTC', 'NAMD']
The trajectories can have different lengths, as seen below.
[3]:
print(len(u1.trajectory), len(u2.trajectory), len(u3.trajectory))
98 102 10
Calculating harmonic similarity
The harmonic ensemble similarity method treats the conformational ensemble within each trajectory as a high-dimensional Gaussian distribution \(N(\mu, \Sigma)\). The mean \(\mu\) is estimated as the average over the ensemble. The covariance matrix \(\Sigma\) is calculated either using a shrinkage estimator (cov_estimator='shrinkage') or a maximum-likelihood method (cov_estimator='ml').
The harmonic ensemble similarity is then calculated using the symmetrised version of the Kullback-Leibler divergence. This has no upper bound, so you can get some very high values for very different ensembles.
The function we will use is encore.hes (API docs here). It is recommended that you align your trajectories before computing the harmonic similarity. You can either do this yourself with align.AlignTraj, or pass align=True into encore.hes. The latter option will align each of your Universes to the current timestep of the first Universe. Note that
since encore.hes will pull your trajectories into memory, this changes the positions of your Universes.
[4]:
hes, details = encore.hes([u1, u2, u3, u4],
                         select='backbone',
                         align=True,
                         cov_estimator='shrinkage',
                         weights='mass')
[5]:
hes
[5]:
array([[      0.        ,   24955.71872716, 1879874.46813977,
         145622.25410712],
       [  24955.71872716,       0.        , 1659867.545991  ,
         161102.33620934],
       [1879874.46813977, 1659867.545991  ,       0.        ,
        9900092.71862812],
       [ 145622.25410712,  161102.33620934, 9900092.71862812,
              0.        ]])
The mean and covariance matrices for each Universe are saved in details.
[6]:
details["ensemble1_mean"]
[6]:
array([14.349085 ,  7.2700276, -8.721732 , ..., 10.346109 , 16.531553 ,
       -6.686297 ], dtype=float32)
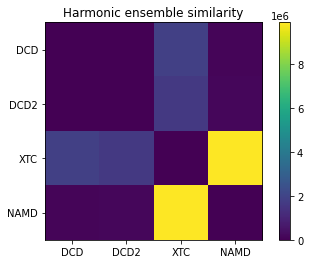
Plotting
[7]:
fig, ax = plt.subplots()
im = plt.imshow(hes)
plt.xticks(np.arange(4), labels)
plt.yticks(np.arange(4), labels)
plt.title('Harmonic ensemble similarity')
cbar = fig.colorbar(im)
References
[1] R. J. Gowers, M. Linke, J. Barnoud, T. J. E. Reddy, M. N. Melo, S. L. Seyler, D. L. Dotson, J. Domanski, S. Buchoux, I. M. Kenney, and O. Beckstein. MDAnalysis: A Python package for the rapid analysis of molecular dynamics simulations. In S. Benthall and S. Rostrup, editors, Proceedings of the 15th Python in Science Conference, pages 98-105, Austin, TX, 2016. SciPy, doi: 10.25080/majora-629e541a-00e.
[2] N. Michaud-Agrawal, E. J. Denning, T. B. Woolf, and O. Beckstein. MDAnalysis: A Toolkit for the Analysis of Molecular Dynamics Simulations. J. Comput. Chem. 32 (2011), 2319-2327, doi:10.1002/jcc.21787. PMCID:PMC3144279
[3] ENCORE: Software for Quantitative Ensemble Comparison. Matteo Tiberti, Elena Papaleo, Tone Bengtsen, Wouter Boomsma, Kresten Lindorff-Larsen. PLoS Comput Biol. 2015, 11, e1004415.
[4] Beckstein O, Denning EJ, Perilla JR, Woolf TB. Zipping and unzipping of adenylate kinase: atomistic insights into the ensemble of open<–>closed transitions. J Mol Biol. 2009;394(1):160–176. doi:10.1016/j.jmb.2009.09.009
References
[1] Oliver Beckstein, Elizabeth J. Denning, Juan R. Perilla, and Thomas B. Woolf. Zipping and Unzipping of Adenylate Kinase: Atomistic Insights into the Ensemble of Open↔Closed Transitions. Journal of Molecular Biology, 394(1):160–176, November 2009. 00107. URL: https://linkinghub.elsevier.com/retrieve/pii/S0022283609011164, doi:10.1016/j.jmb.2009.09.009.
[2] Richard J. Gowers, Max Linke, Jonathan Barnoud, Tyler J. E. Reddy, Manuel N. Melo, Sean L. Seyler, Jan Domański, David L. Dotson, Sébastien Buchoux, Ian M. Kenney, and Oliver Beckstein. MDAnalysis: A Python Package for the Rapid Analysis of Molecular Dynamics Simulations. Proceedings of the 15th Python in Science Conference, pages 98–105, 2016. 00152. URL: https://conference.scipy.org/proceedings/scipy2016/oliver_beckstein.html, doi:10.25080/Majora-629e541a-00e.
[3] Naveen Michaud-Agrawal, Elizabeth J. Denning, Thomas B. Woolf, and Oliver Beckstein. MDAnalysis: A toolkit for the analysis of molecular dynamics simulations. Journal of Computational Chemistry, 32(10):2319–2327, July 2011. 00778. URL: http://doi.wiley.com/10.1002/jcc.21787, doi:10.1002/jcc.21787.
[4] Matteo Tiberti, Elena Papaleo, Tone Bengtsen, Wouter Boomsma, and Kresten Lindorff-Larsen. ENCORE: Software for Quantitative Ensemble Comparison. PLOS Computational Biology, 11(10):e1004415, October 2015. 00031. URL: https://journals.plos.org/ploscompbiol/article?id=10.1371/journal.pcbi.1004415, doi:10.1371/journal.pcbi.1004415.