Determining the persistence length of a polymer
Here we determine the persistence length of a polymer.
Last executed: Dec 27, 2020 with MDAnalysis 1.0.0
Last updated: January 2020
Minimum version of MDAnalysis: 1.0.0
Packages required:
[1]:
import MDAnalysis as mda
from MDAnalysis.tests.datafiles import TRZ_psf, TRZ
from MDAnalysis.analysis import polymer
%matplotlib inline
Loading files
The test files we will be working with here feature a pure polymer melt of a polyamide.
[2]:
u = mda.Universe(TRZ_psf, TRZ)
Choosing the chains and backbone atoms
We can define the chains of polyamide to be the common definition of a molecule: where each atom is bonded to at least one other in the group, and not bonded to any atom outside the group. MDAnalysis provides these as fragments.
[3]:
chains = u.atoms.fragments
We then want to select only the backbone atoms for each chain, i.e. only the carbons and nitrogens.
[4]:
backbones = [ch.select_atoms('not name O* H*') for ch in chains]
This should give us AtomGroups where the spatial arrangement is linear. However, the atoms are in index order. We can use sort_backbone to arrange our atom groups into their linear arrangement order.
[5]:
sorted_bb = [polymer.sort_backbone(bb) for bb in backbones]
Calculating the persistence length
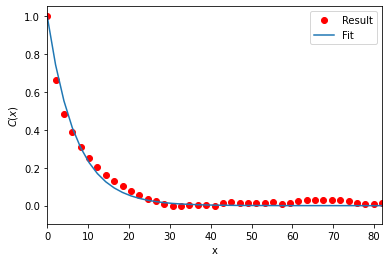
The persistence length is the length at which two points on the polymer chain become decorrelated. This is determined by first measuring the autocorrelation \(C(n)\) of two bond vectors \((\mathbf{a}_i, \mathbf{a}_{i + n})\) separated by \(n\) bonds, where
An exponential decay is then fitted to this, which yields the persistence length \(l_P\) from the average bond length \(\bar{l_B}\).
We set up our PersistenceLength class (API docs). Note that every chain we pass into it must have the same length.
[6]:
plen = polymer.PersistenceLength(sorted_bb)
plen.run()
[6]:
<MDAnalysis.analysis.polymer.PersistenceLength at 0x7f80e4e66dc0>
The average bond length is found at plen.lb, the calculated persistence length at plen.lp, the measured autocorrelation at plen.results and the modelled decorrelation fit at plen.fit.
[7]:
print(plen.results.shape)
print('The persistence length is {}'.format(plen.lp))
(179,)
The persistence length is 6.917464580166461
MDAnalysis.analysis.polymer.PersistenceLength provides a convenience method to plot the results.
[8]:
plen.plot()
[8]:
<matplotlib.axes._subplots.AxesSubplot at 0x7f80e548d4c0>
References
[1] Richard J. Gowers, Max Linke, Jonathan Barnoud, Tyler J. E. Reddy, Manuel N. Melo, Sean L. Seyler, Jan Domański, David L. Dotson, Sébastien Buchoux, Ian M. Kenney, and Oliver Beckstein. MDAnalysis: A Python Package for the Rapid Analysis of Molecular Dynamics Simulations. Proceedings of the 15th Python in Science Conference, pages 98–105, 2016. 00152. URL: https://conference.scipy.org/proceedings/scipy2016/oliver_beckstein.html, doi:10.25080/Majora-629e541a-00e.
[2] Naveen Michaud-Agrawal, Elizabeth J. Denning, Thomas B. Woolf, and Oliver Beckstein. MDAnalysis: A toolkit for the analysis of molecular dynamics simulations. Journal of Computational Chemistry, 32(10):2319–2327, July 2011. 00778. URL: http://doi.wiley.com/10.1002/jcc.21787, doi:10.1002/jcc.21787.