Q1 vs Q2 contact analysis
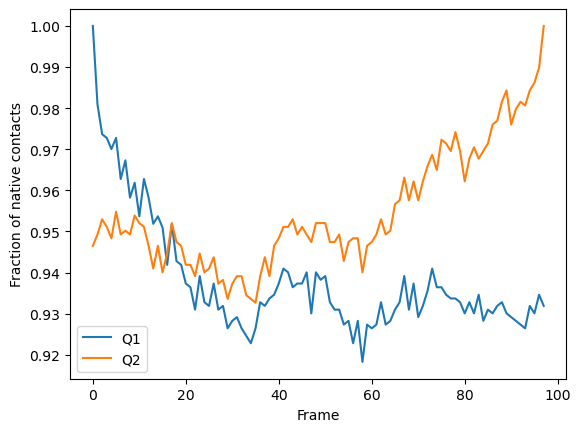
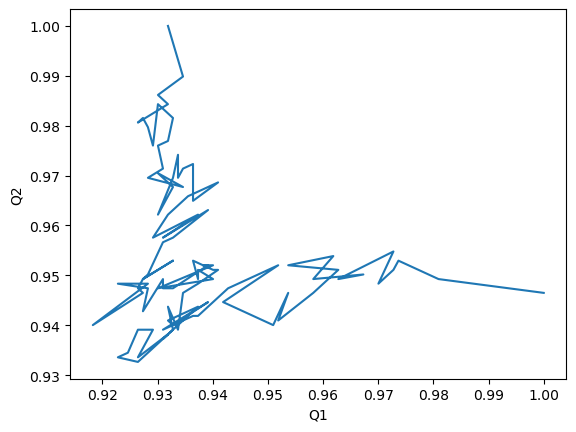
Here we calculate a Q1 vs Q2 plot, where Q1 refers to fraction of native contacts along a trajectory with reference to the first frame, and Q2 represents the fraction of native contacts with reference to the last.
Last updated: December 2022 with MDAnalysis 2.4.0-dev0
Minimum version of MDAnalysis: 0.17.0
Packages required:
MDAnalysisTests
See also
Note
The contacts.q1q2 function uses the radius_cut_q method to calculate the fraction of native contacts for a conformation by determining that atoms i and j are in contact if they are within a given radius ([FKDD07], [BHE13])
[1]:
import MDAnalysis as mda
from MDAnalysis.tests.datafiles import PSF, DCD
from MDAnalysis.analysis import contacts

import numpy as np
import pandas as pd
import matplotlib.pyplot as plt
%matplotlib inline
Background
Please see the Fraction of native contacts for an introduction to general native contacts analysis.
Loading files
The test files we will be working with here feature adenylate kinase (AdK), a phosophotransferase enzyme. ([BDPW09]) The trajectory DCD samples a transition from a closed to an open conformation.
[2]:
u = mda.Universe(PSF, DCD)
/home/pbarletta/mambaforge/envs/guide/lib/python3.9/site-packages/MDAnalysis/coordinates/DCD.py:165: DeprecationWarning: DCDReader currently makes independent timesteps by copying self.ts while other readers update self.ts inplace. This behavior will be changed in 3.0 to be the same as other readers. Read more at https://github.com/MDAnalysis/mdanalysis/issues/3889 to learn if this change in behavior might affect you.
  warnings.warn("DCDReader currently makes independent timesteps"
Calculating Q1 vs Q2
We choose to calculate contacts for all the alpha-carbons in the protein, and define the contact radius cutoff at 8 Angstrom. contacts.q1q2 returns a contacts.Contacts object, which we can run directly.
[3]:
q1q2 = contacts.q1q2(u, 'name CA', radius=8).run()
The data is in q1q2.timeseries. The first column of the data is always the frame number.
[4]:
q1q2_df = pd.DataFrame(q1q2.results.timeseries,
                       columns=['Frame',
                                'Q1',
                                'Q2'])
q1q2_df.head()
[4]:
| Frame | Q1 | Q2 | |
|---|---|---|---|
| 0 | 0.0 | 1.000000 | 0.946494 |
| 1 | 1.0 | 0.980926 | 0.949262 |
| 2 | 2.0 | 0.973660 | 0.952952 |
| 3 | 3.0 | 0.972752 | 0.951107 |
| 4 | 4.0 | 0.970027 | 0.948339 |
Plotting
We can plot the fraction of native contacts over time.
[5]:
q1q2_df.plot(x='Frame')
plt.ylabel('Fraction of native contacts')
[5]:
Text(0, 0.5, 'Fraction of native contacts')

Alternatively, we can create a Q1 vs Q2 plot to characterise the transition of AdK from its opened to closed position.
[6]:
q1q2_df.plot(x='Q1', y='Q2', legend=False)
plt.ylabel('Q2')
[6]:
Text(0, 0.5, 'Q2')

References
[1] Oliver Beckstein, Elizabeth J. Denning, Juan R. Perilla, and Thomas B. Woolf. Zipping and Unzipping of Adenylate Kinase: Atomistic Insights into the Ensemble of Open↔Closed Transitions. Journal of Molecular Biology, 394(1):160–176, November 2009.
URL: https://linkinghub.elsevier.com/retrieve/pii/S0022283609011164, doi:10.1016/j.jmb.2009.09.009.
[2] R. B. Best, G. Hummer, and W. A. Eaton. Native contacts determine protein folding mechanisms in atomistic simulations. Proceedings of the National Academy of Sciences, 110(44):17874–17879, October 2013.
URL: http://www.pnas.org/cgi/doi/10.1073/pnas.1311599110, doi:10.1073/pnas.1311599110.
[3] Joel Franklin, Patrice Koehl, Sebastian Doniach, and Marc Delarue. MinActionPath: maximum likelihood trajectory for large-scale structural transitions in a coarse-grained locally harmonic energy landscape. Nucleic Acids Research, 35(suppl_2):W477–W482, July 2007.
URL: https://academic.oup.com/nar/article-lookup/doi/10.1093/nar/gkm342, doi:10.1093/nar/gkm342.
[4] Richard J. Gowers, Max Linke, Jonathan Barnoud, Tyler J. E. Reddy, Manuel N. Melo, Sean L. Seyler, Jan Domański, David L. Dotson, Sébastien Buchoux, Ian M. Kenney, and Oliver Beckstein. MDAnalysis: A Python Package for the Rapid Analysis of Molecular Dynamics Simulations. Proceedings of the 15th Python in Science Conference, pages 98–105, 2016.
URL: https://conference.scipy.org/proceedings/scipy2016/oliver_beckstein.html, doi:10.25080/Majora-629e541a-00e.
[5] Naveen Michaud-Agrawal, Elizabeth J. Denning, Thomas B. Woolf, and Oliver Beckstein. MDAnalysis: A toolkit for the analysis of molecular dynamics simulations. Journal of Computational Chemistry, 32(10):2319–2327, July 2011.
URL: http://doi.wiley.com/10.1002/jcc.21787, doi:10.1002/jcc.21787.